
A Log-azimuthal map of the world (as seen from Adelaide, Australia, my home town) using log-distances, is a map that shows places close by are displayed in detail, and those further away, have less.
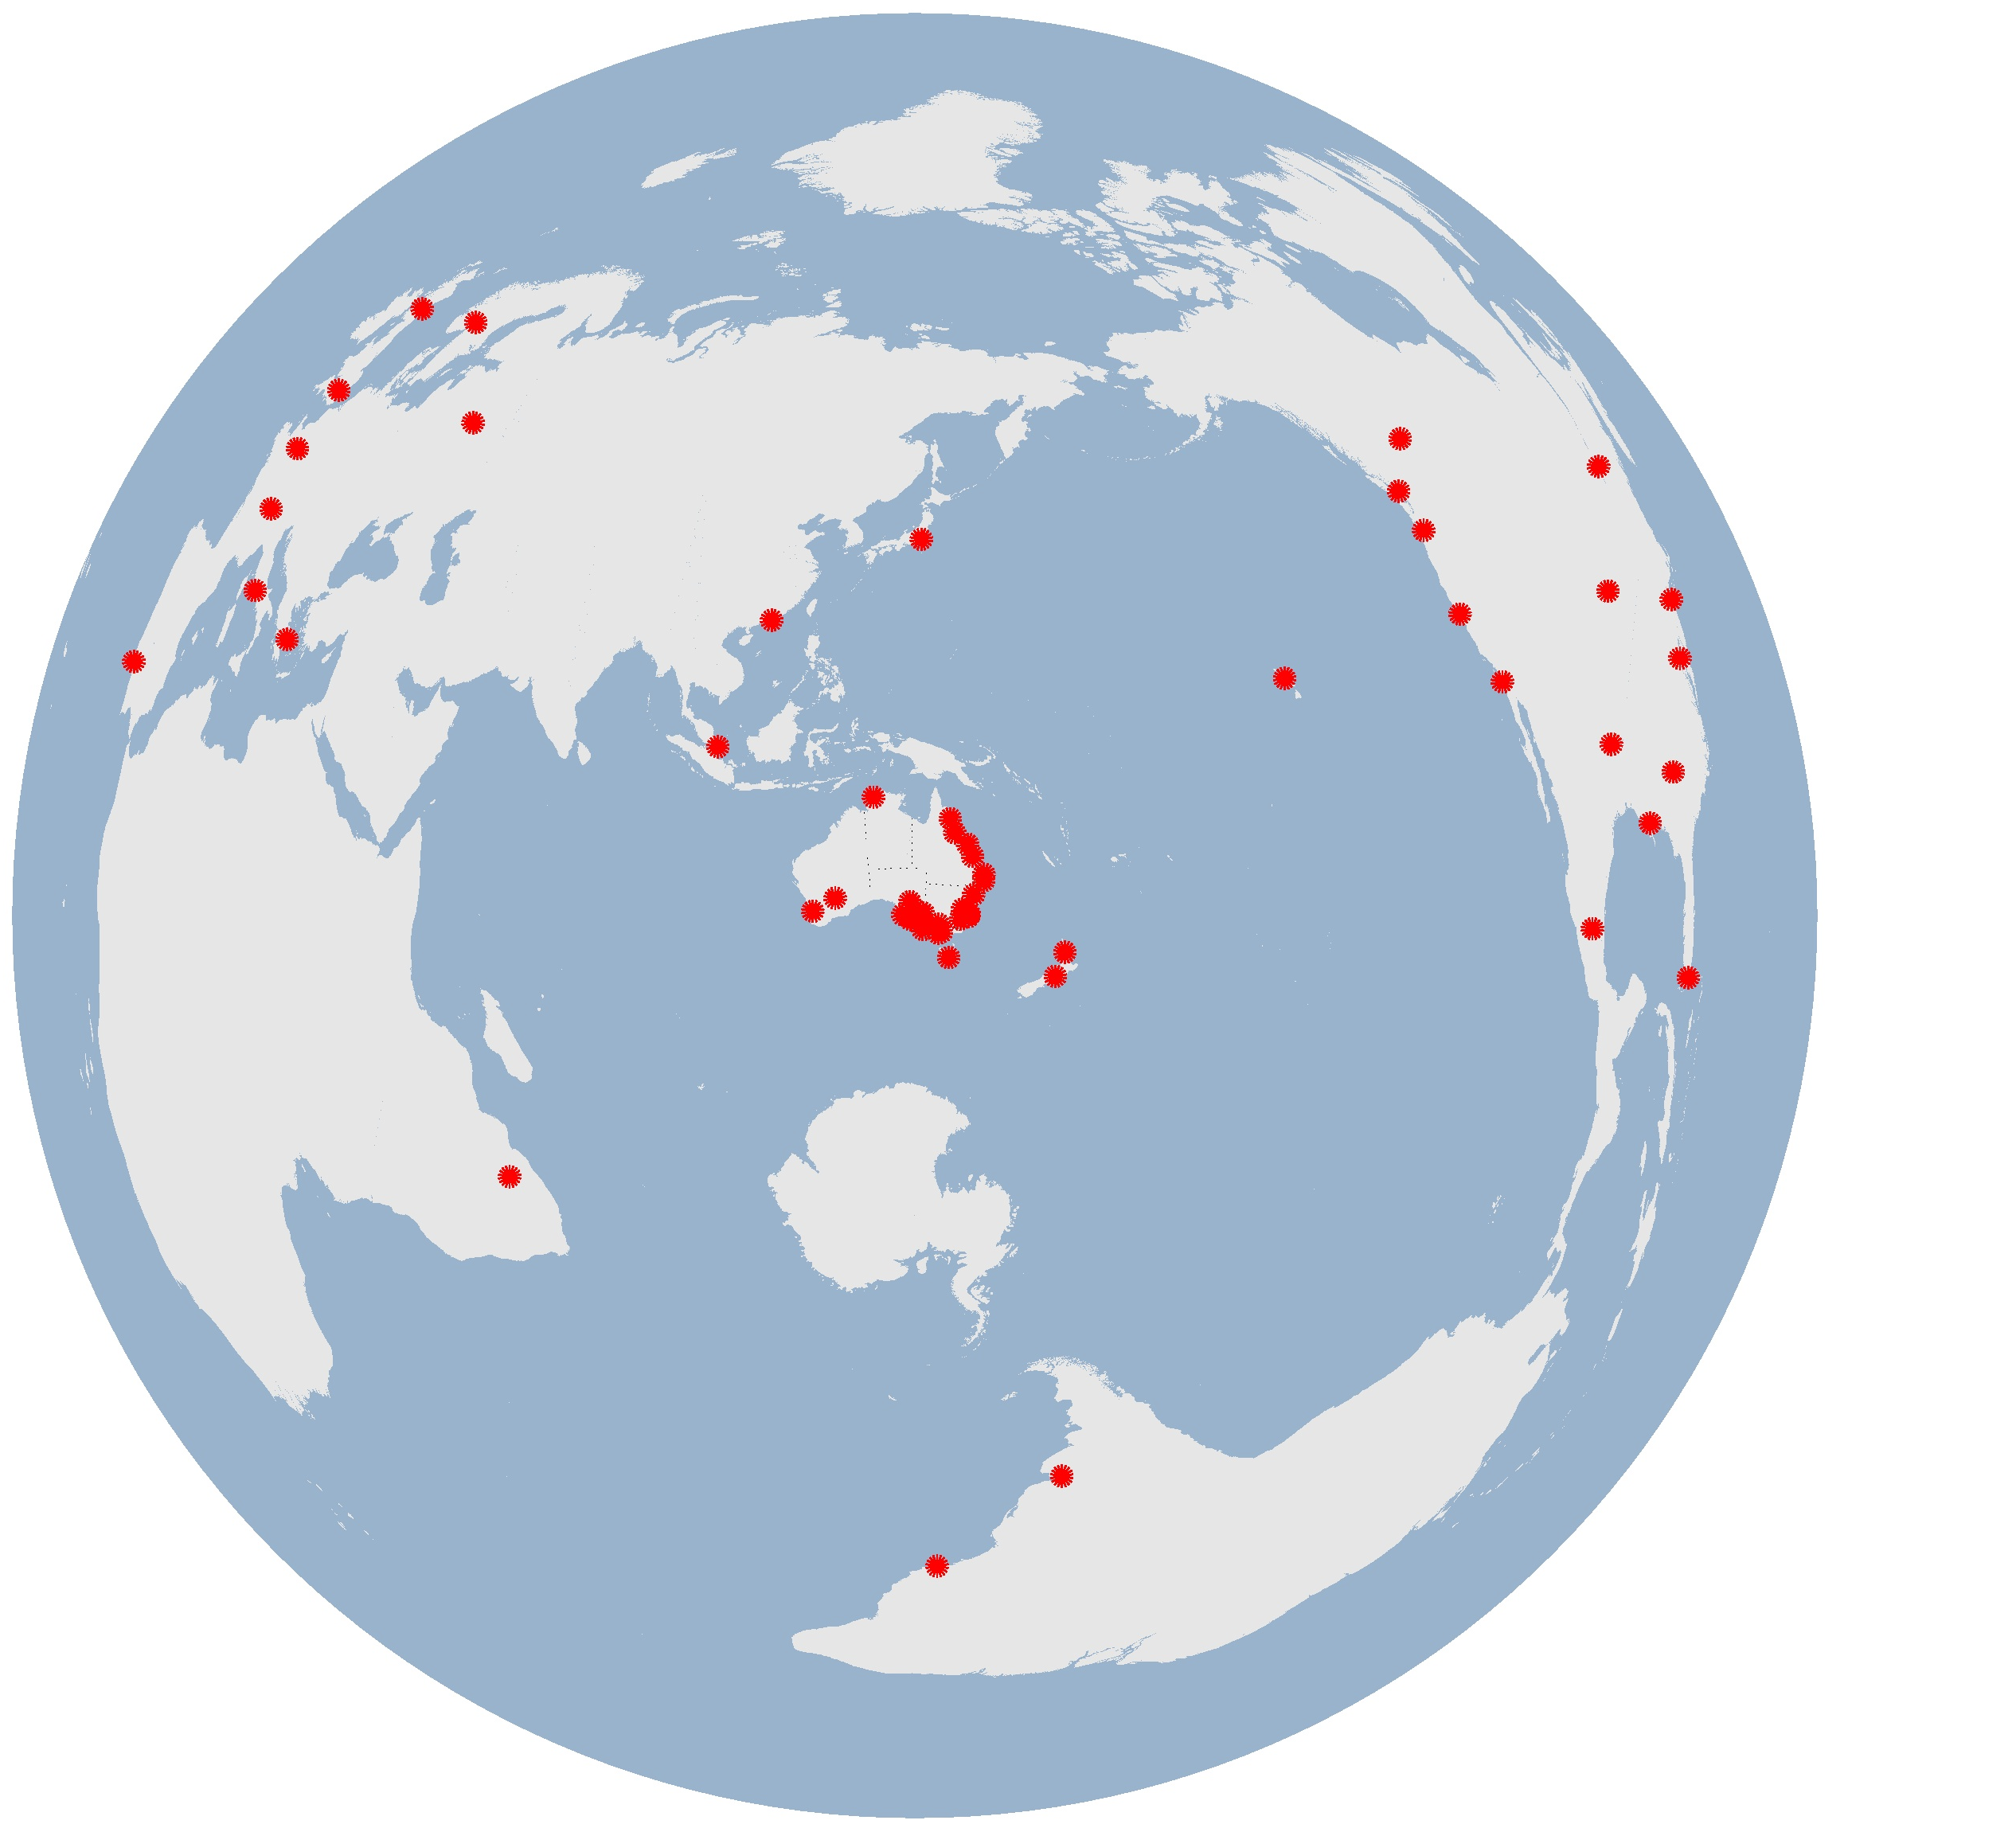
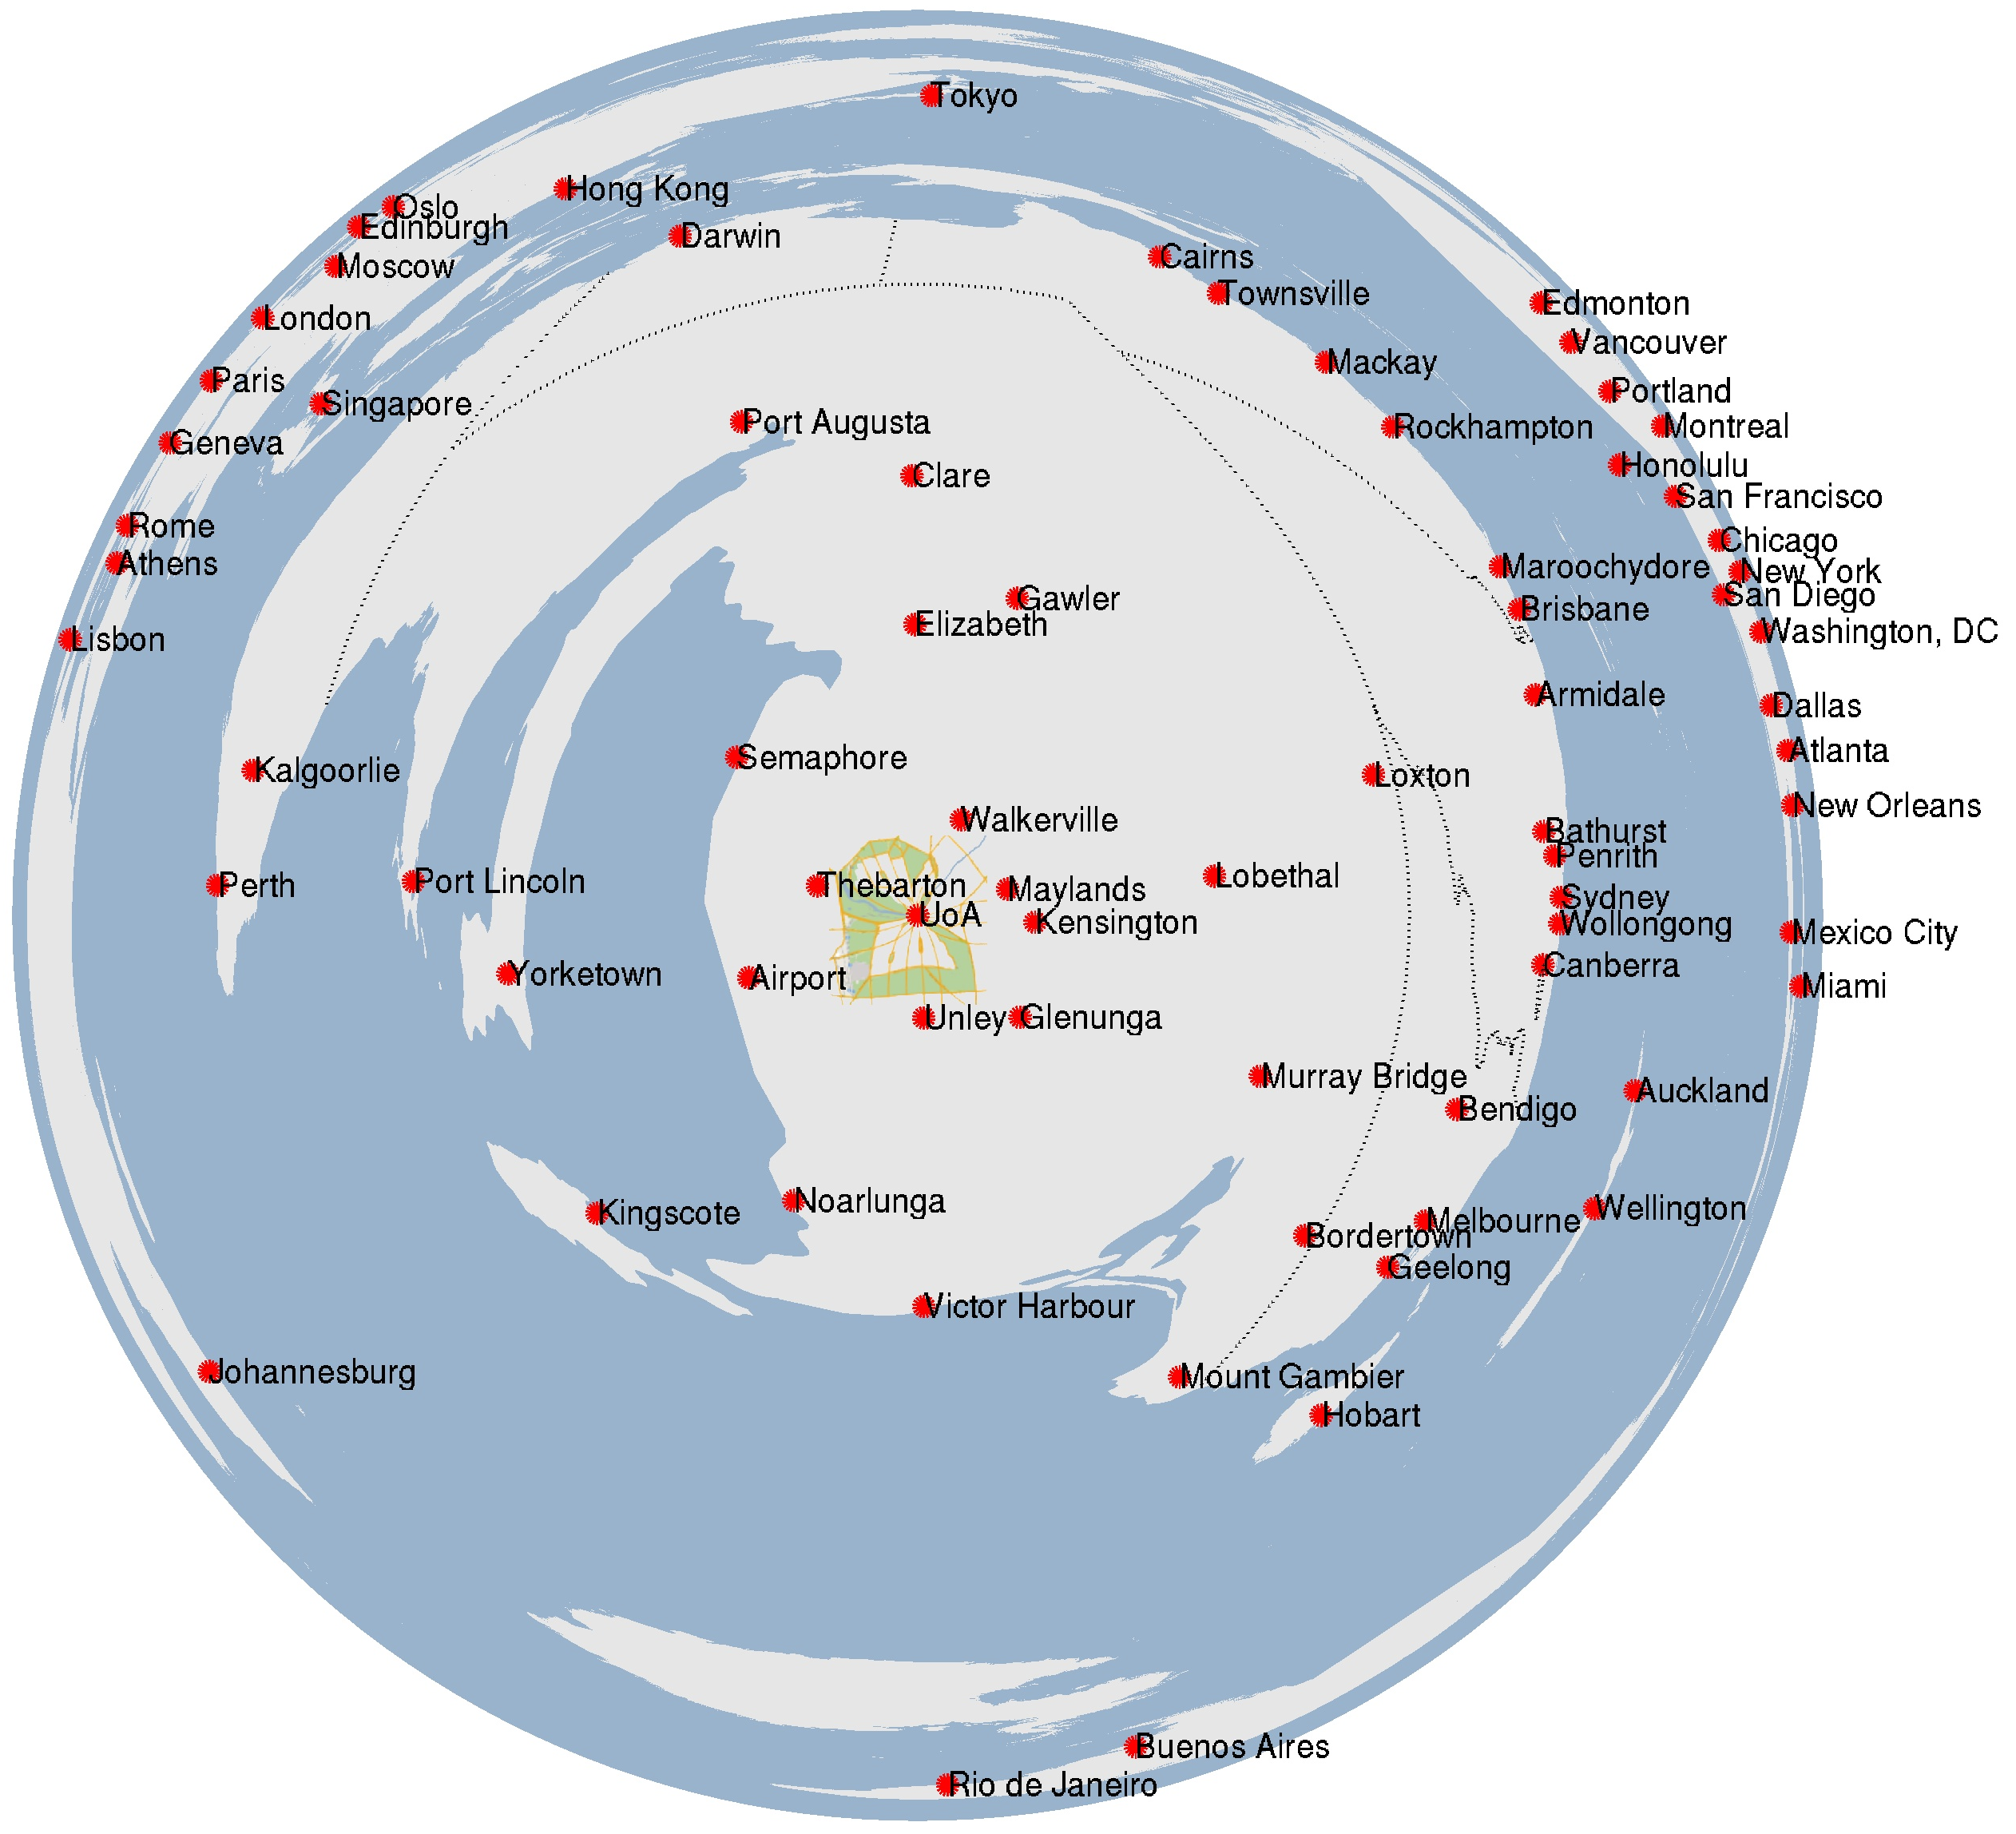
The first plot is a standard Azimuthal map, and the second is its logarithmic version. Both are projections with Adelaide at the centre.
The two maps shown are azimuthal in that directions from Adelaide to other locations in the world are correct. There are lots of examples of different types of azimuthal maps centered at different locations on the globe. There’s even a tool for drawing them on your own.
In the map on the left, distances from Adelaide to the rest of the world are preserved, so it is a Azimuthal equidistant projection.
In the map on the right, the distances shown are the log of the real geographic distance. The projection was invented by Swedish geographer Torsten Hagerstrand (“Migration and area: migration in Sweden”, Lund Studies in Geography, Series B, No.13, pp.27-158, 1957). The map emphasizes locations close by, so I have drawn the detailed (thoogh distorted) city center on the map, and some local suburbs, as well as state boundaries for Australia. Other ccountries tend to get blurred together by the log transform, and so I have only bothered with a few major cities to help understand where locations are on the distorted continent shapes.
The interesting thing about such maps is that it approximates our perception of distances. Much of human perception is logarithmic. The Weber-Fechner law notes this and notes its origin in the fact that the smallest differences (say in weight) that we can detect is proportional to the initial weight, leading naturally to a log law.
Many perceptual scales are logarithmic as a result: for instance dB (for sound or signal strength), the Richter scale for Earthquakes, stellar magnitude, the equal-temperment musical scale for pitch and pH. No less so distances: from Australia it seems that Ediburgh and London are close together, but in reality they are nearly as far apart as Adelaide and Melbourne. The log-azimuthal projection somewhat reflects this subjective view of distance, though it perhaps over-emphasizes direction (from Adelaide) over distances.
The only other log-azimuthal projection I have seen on the web is http://www.gis.psu.edu/projection/chap6figs.html, but you’ll find the link is dead these days, so the link above is through the wayback machine.
Note there is actually a small hole (radius 1km) in the center of the map where $$log(distance)<0,$$ and so the points cannot be plotted. The size of this hole depends on an arbitrary scaling term, but I haven’t heard that discussed before.
The data for the map came from http://www.naturalearthdata.com/, http://www.satsig.net/maps/lat-long-finder.htm, and Google maps. The map was drawn using matlab and the M_map toolbox (plus some fairly custom code).